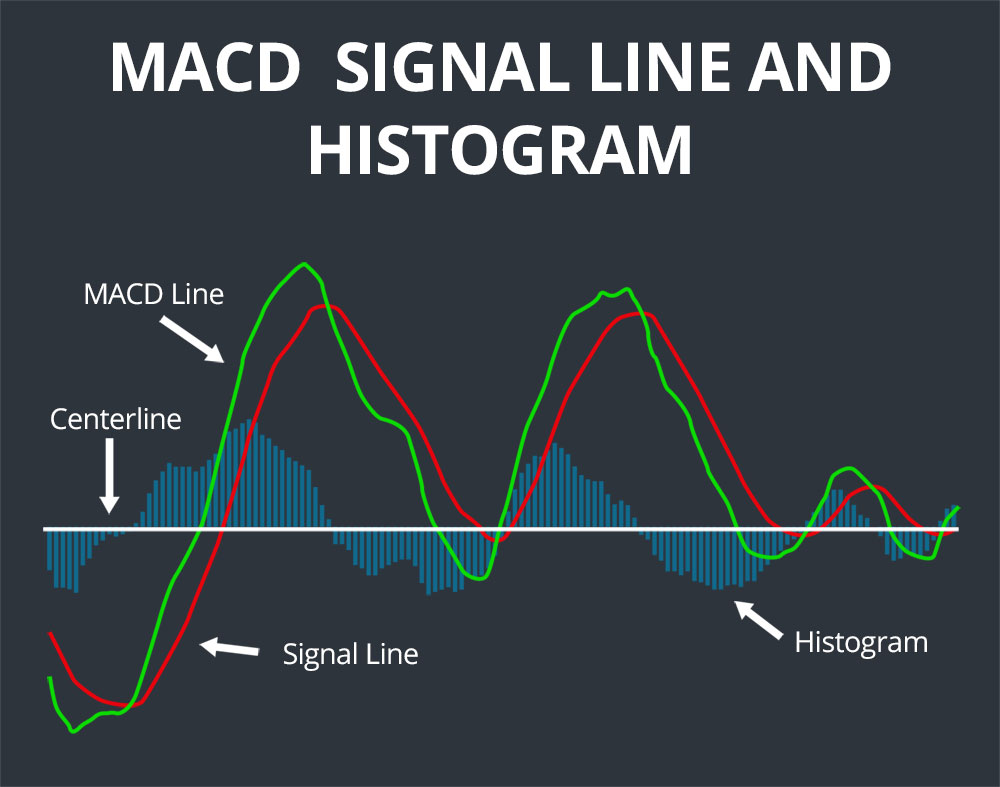
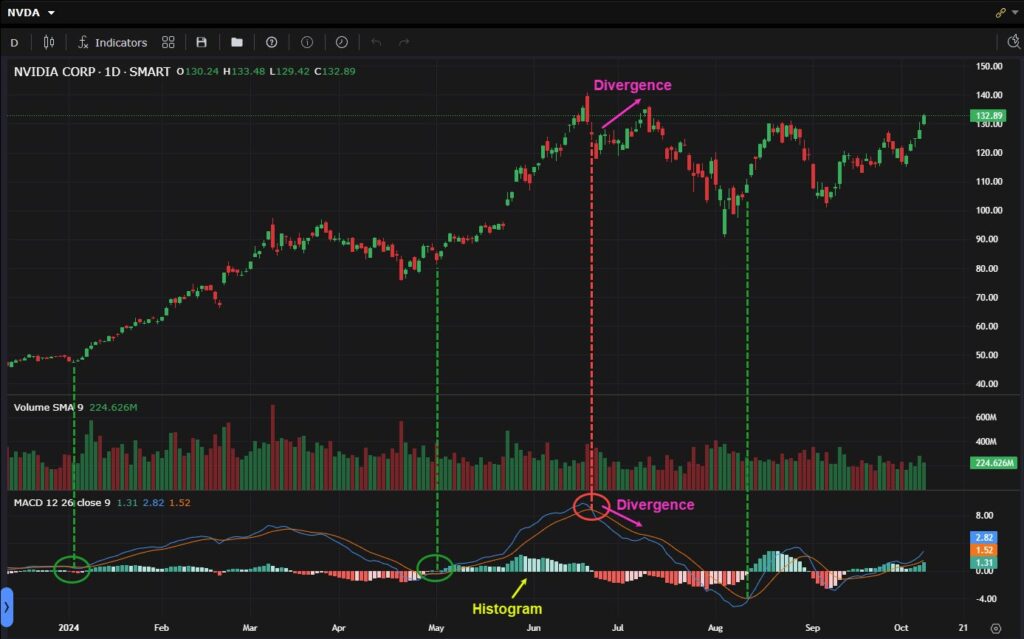
MACD, or Moving Average Convergence Divergence, is a commonly used technical indicator in stock analysis that reflects market movements and provides buy and sell signals.
The MACD Line was created in 1979 by inventor Gerald Appel and is considered one of the most popular and widely used indicators in investment analysis.
The MACD value is calculated by subtracting the 26-day Exponential Moving Average (EMA) from the 12-day EMA:
MACD = EMA(12) – EMA(26)
If the 12-day EMA is greater than the 26-day EMA, the MACD is positive. Conversely, if the 12-day EMA is less than the 26-day EMA, the MACD is negative.
In addition to the basic MACD Line, there is also a Signal Line, which is the 9-day EMA of the MACD. Combining the analysis of the Signal Line with the MACD Line can help identify entry and exit points in the market.

Here are some ways to apply MACD on stocks, along with examples for better understanding.
- Crossing Signals Between MACD Line and Signal Line
- How to Implement:
- When the MACD Line crosses above the Signal Line, it may be a buy signal.
- When the MACD Line crosses below the Signal Line, it may be a sell signal.
- Example:
- Suppose you are monitoring stock XYZ. If the MACD Line crosses above the Signal Line on June 15, you might consider buying this stock. Conversely, if on July 20 the MACD Line crosses below the Signal Line, you should consider selling.
- How to Implement:
- Identifying Trends
- How to Implement:
- Monitor the position of the MACD Line in relation to the zero line. If the MACD Line is above zero, the stock is in an uptrend. If it is below zero, the stock is in a downtrend.
- Example:
- Stock ABC has the MACD Line consistently above zero throughout August. You may maintain a buy position during that month due to a strong uptrend. If in September the MACD Line starts falling below zero, you might consider taking profits or looking for selling opportunities.
- How to Implement:
- Using the Histogram to Assess Trend Strength
- How to Implement:
- Observe the Histogram. If the Histogram is expanding (lengthening), the trend is strong. If the Histogram is contracting (shortening), the trend may be weakening.
- Example:
- If you see the Histogram for stock DEF increasing significantly in October, this indicates a strong uptrend. However, if the Histogram starts to contract in mid-November, you might consider taking profits or looking for signs of a reversal.
- How to Implement:
- Looking for Divergence
- How to Implement:
- Monitor for divergence between price and MACD. If the price is rising but MACD is falling, there may be a sign of weakening in the uptrend and a potential reversal.
- Example:
- Stock GHI rises from 50 to 60, but the MACD declines. This could be a signal that the uptrend is losing strength and may be preparing for a reversal. You might consider selling or reducing your position.
- How to Implement:
- Combining with Other Indicators
- How to Implement:
- Combine MACD with other indicators such as RSI (Relative Strength Index) or Bollinger Bands for a more comprehensive view of the market.
- Example:
- If you notice MACD giving a buy signal, but RSI indicates the stock is in the overbought zone (above 70), you may decide not to enter a trade immediately, as the market might correct.
- How to Implement:

Notes When Using MACD:
- Time Frame: MACD may be more effective in larger time frames (such as daily or weekly) compared to smaller time frames (such as hourly or minute) due to its lagging nature.
- Patience and Risk Management: Don’t forget to manage risk by setting stop-loss orders and be patient while waiting for clear signals.
By applying these strategies and practicing regularly, you can effectively leverage the MACD indicator to make better trading decisions in the stock market.

